By Dave Thomson | 13th September 2021 | Pupil demographics
This is the second part of a two-part blogpost. Part 1 can be found here.
During 2021 I’ve been doing some research on alternative provision using National Pupil Database (NPD) to fill in some of the evidence gaps uncovered by the Centre for Social Justice in their AP coldspots report. This work has been undertaken on behalf of the IntegratED Partnership and kindly funded by Porticus UK.
In this two-part blogpost, I summarise some key findings. Links are provided to more detailed analysis for those who are interested.
In this part I look at the characteristics of pupils who access AP, re-integration to mainstream and special schools and post-16 destinations.
I should underline that the analysis covers the pre-pandemic period up to summer 2019 and so may not reflect the current situation.
The overlap between social care, alternative provision and special educational needs
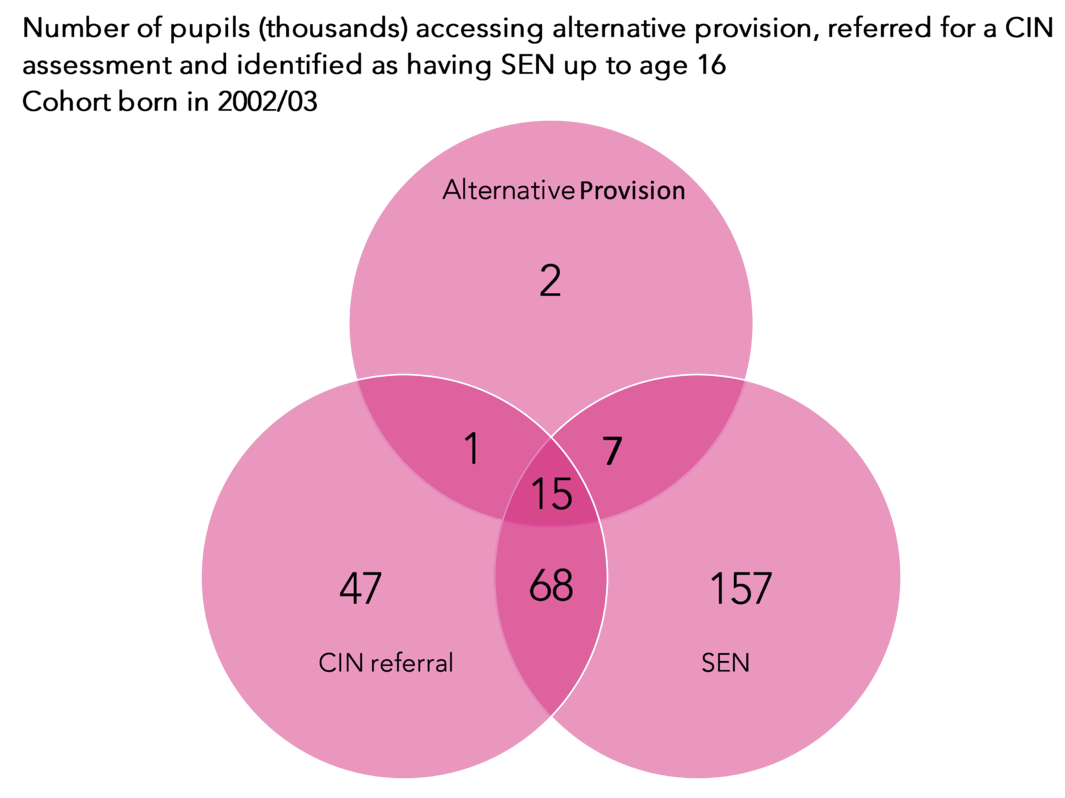
In this blogpost, we showed that the majority of pupils who experience alternative provision are identified as having special educational needs and are referred to social services for a child in need assessment during their school career.

Consequently, budget cuts for SEN, children’s social care and allied services such as child and adolescent mental health services (CAMHS) will have disproportionately affected pupils in state-funded AP. Effective joint-working between these services would seem to be (on the surface at least) essential for improving the outcomes of young people who experience alternative provision.
To what extent are pupils who are permanently excluded or who spend time in AP reintegrated into mainstream and special schools?
In this report, we examine the extent to which pupils return to mainstream or special schools to complete Key Stage 4 having experienced:
- Permanent exclusion;
- State-funded AP schools; or
- Local authority alternative provision.
We consider pupils who complete Key Stage 4 in a mainstream or special school to have been re-integrated. End of Key Stage 4 destinations are summarised for each group in seven cohorts below.

Just under half of pupils who attend state-funded AP schools before the age of 16 complete Key Stage 4 at a state-funded mainstream or special school. Around 40% do so within the state-funded AP sector. Some of these pupils will have been dual-rolled, in other words attending mainstream or special school at the same time as an AP school.
Among all three groups, 5% to 9% of pupils in each cohort appear to drop out of the system. That is to say, do not appear in Key Stage 4 data nor appear to be on roll in January to June of Year 11.
In the report we show that the younger pupils are when they first experience permanent exclusion or alternative provision, the more likely are to return to mainstream or special schools to complete Key Stage 4. However, the propensity to be permanently excluded or to be placed at a state-funded AP school increases with age.
Children looked after and children in need were found to be less likely to return to mainstream or special schools having experienced permanent exclusion or alternative provision even after controlling for other demographic characteristics and school history.
What happens after AP?
Very few AP schools have sixth forms. This means that pupils registered at AP schools at the end of Year 11 have to transfer to other schools or colleges to continue in education.
We already knew from DfE statistics that less than 40% of pupils who complete Key Stage 4 at an AP school are in sustained education and training destinations between October and March at age 16. This is despite the law requiring young people to remain in education and training until their 18th birthday.
In this briefing (and statistical appendix), we go further and examine the post-16 destinations at both age 16 and 17 of all pupils who experience AP schools pre 16.
We use four data sources to identify activities undertaken by learners at academic ages 16 and 17:
- School Census
- Local Authority Alternative Provision Census (LAAPC)
- Individualised Learner Record (ILR)
- National Client Caseload Information System (NCCIS)
Briefly, school census provides information on enrolments in state-funded mainstream, special and AP schools. LAAPC contains details of young people educated in other settings for which the local authority pays fees. ILR includes details of publicly- funded[1] qualifications taken in the further education system, which includes Colleges, work-based learning providers, employers and local authorities. Finally, NCCIS contains monthly activity indicators for young people aged 16-17 compiled by local authorities using a mixture of data and caseworker contacts.
We use the various sources to identify young people participating in education and training on three dates at age 16 and three dates at age 17. These dates correspond to the enumeration dates of the termly School Census. The chart below shows the proportion of all young people in four birth cohorts who experienced state-funded AP schools up to age 16 who were participating in education each term at 16 and 17.

Considering all pupils who experience AP schools pre-16, around 57% are observed in education in Autumn at age 16. This falls to 36% by summer at age 17. Equivalent figures for pupils who don’t experience AP pre-16 are 94% and 82% respectively.
In summary
Around 3% of pupils experience a placement at a state-funded AP school during their school career. The majority were known to social services or had been identified as having special educational needs prior to entering the sector (and often both).
Outcomes for these pupils, including attainment, attendance and post-16 destinations, tend to be poor. That isn’t to say that alternative provision is the cause, of course.
Although we have started to fill in some evidence gaps, others remain.
Further work is ongoing on the long-term outcomes, including employment and earnings, for young people who experience alternative provision.
And the number of pupils accessing independent alternative provision funded by their school remains unknown. The voluntary collection of this data via School Census may provide some evidence in future.
Finally, this analysis covers the pre-pandemic period. Things may have changed in the AP sector. For instance, £7 million in emergency funding was provided to support transition to post-16 last year. We will see later this year what impact this has had.Notes
[1] Funded by the Education and Skills Funding Agency (ESFA)
Want to stay up-to-date with the latest research from FFT Education Datalab? Sign up to Datalab’s mailing list to get notifications about new blogposts, or to receive the team’s half-termly newsletter.