By Dave Thomson | 13th September 2021 | Pupil demographics
This is the first part of a two-part blogpost. Part 2 can be found here.
During 2021 I’ve been doing some research on alternative provision using National Pupil Database (NPD) to fill in some of the evidence gaps uncovered by the Centre for Social Justice in their AP coldspots report. This work has been undertaken on behalf of the IntegratED Partnership and kindly funded by Porticus UK.
In this two-part blogpost, I summarise some key findings. Links are provided to more detailed analysis for those who are interested.
In this part I quantify how many young people experience AP schools during their school career and what they tend to achieve at the end of Key Stage 4.
I should underline that the analysis covers the pre-pandemic period up to summer 2019 and so may not reflect the current situation.
How many pupils access AP during their school career?
DfE statistics on pupil numbers show that there were 12,785 pupils on roll in AP schools (pupil referral units and alternative provision free schools / academies) in January 2021 compared to 15,396 the previous year.
However, these figures only include pupils with a ‘current’ or ‘main’ registration. They do not include dual-rolled pupils who have a subsidiary registration, or pupils with other registration types attending AP schools.
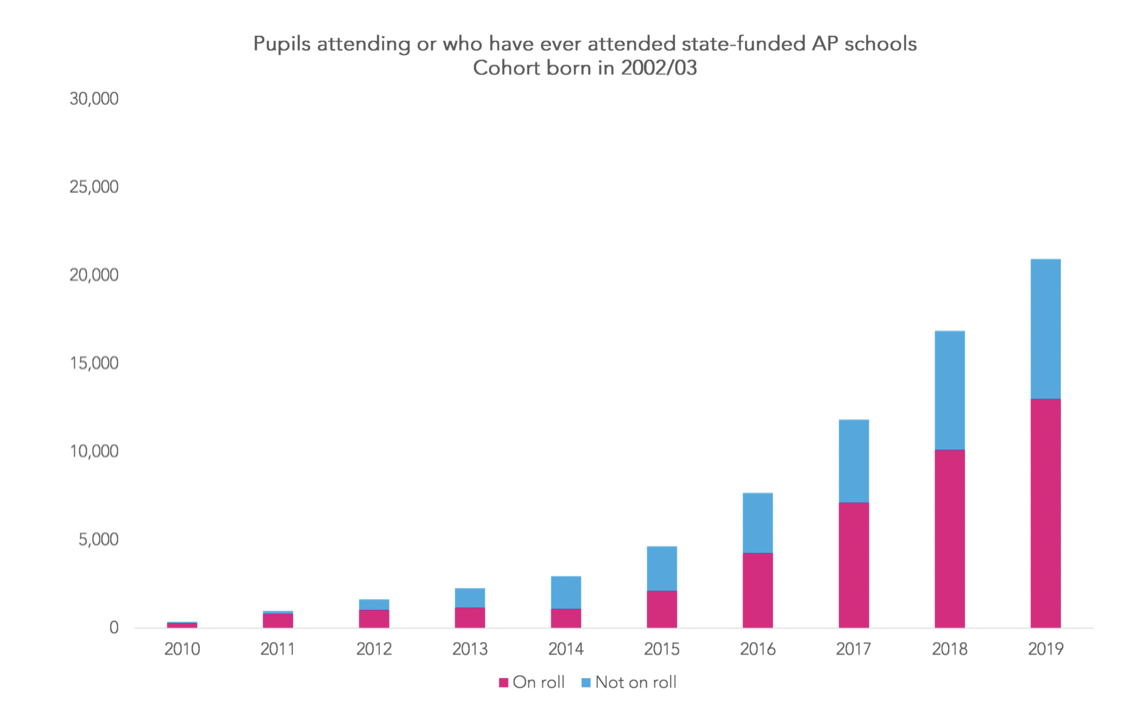
Among the cohort born in 2002/03, around 22,000 pupils (3%) had experienced AP schools by the time they were 16, the majority either in 2018 (aged 14) or in 2019 (aged 15).

If we include those in alternative provision funded by a local authority, which includes pupils placed in independent special schools as well as independent alternative provision, the percentage of pupils in a cohort experiencing AP increases to 4%.
However, we do not know about pupils who experience independent alternative provision paid for by their school.
More on numbers accessing state-funded AP schools during their school career can be found here.
How can AP settings be assessed for quality?
Relatively little information is published about the characteristics and outcomes of pupils who attend alternative provision in England.
Although data on Key Stage 4 attainment for pupils in AP schools is published by the DfE, it only includes pupils who reach the end of Key Stage 4 at AP schools. Moreover, data is not published for individual AP schools. Instead, it is aggregated to local authority level.
Part of the reason data on AP schools is not published is the sheer heterogeneity of the sector. Alternative provision tends to be synonymous with permanent exclusion but this is only one reason why pupils may enter the sector (We wrote here that not all pupils who end up in alternative provision have been permanently excluded). Other reasons may include illness, pregnancy, lack of a school place or as a short-term intervention to improve behaviour.
Similarly, there is heterogeneity in types of alternative provision. This includes pupil referral units, alternative provision free schools/ academies and independent alternative provision settings. It may also include other types of setting (including FE Colleges and one-on-one tuition) paid for by local authorities.
In this report, we look at how administrative data on attainment and attendance available from the National Pupil Database (NPD) could be used to assess alternative provision schools for quality and to build a picture of the educational histories of those accessing alternative provision. We emphasise here that attainment and attendance are just two dimensions of quality. There are others, such as health and well-being and how well schools work with other agencies, which cannot be analysed using administrative data. Further dimensions of quality are summarised in the Centre for Social Justice toolkit.
We develop an overall measure of attainment for AP schools called Attainment5. This is like Attainment8 but without the “slots” for EBacc subjects. In other words, it is based on English, maths and 3 other subjects equivalent in size to GCSEs.
One challenge we had to overcome is that, since the Wolf Review, DfE attainment statistics have only included a subset of qualifications. Some qualifications widely used in the AP sector, including functional skills, are no longer counted. As a result, DfE statistics do not comprehensively summarise the attainment of pupils who access AP.
Therefore, we base our Attainment5 measure on all qualifications, including those DfE no longer include. For example, the English slot of the measure includes functional skills in literacy as well as GCSE English.
In the chart below, we summarise a three-year average for Attainment5 for AP settings. We include all pupils ever on roll aged 11 to 15, regardless of where they completed Key Stage 4. The average Attainment5 score is 12.4. Given that there are 7 ‘slots’ in the Attainment5 measure (English double-weighted, maths double-weighted and any 3 other subjects), this is equivalent to below grade 2 at GCSE on average.

In addition to showing variation in Attainment5 scores between AP schools, it also shows how they vary in size.
The report provides some ideas about how to make fairer comparisons of attainment and absence outcomes for AP schools that reflect differences in pupil populations.
Now read part 2.
Want to stay up-to-date with the latest research from FFT Education Datalab? Sign up to Datalab’s mailing list to get notifications about new blogposts, or to receive the team’s half-termly newsletter.