Last week the DfE launched a consultation on plans to “improve consistency of support” to tackle school absence.
As the title suggests, it aims to ensure that all pupils experience the same (good) attendance provision regardless of the school and Local Authority (and MAT) they find themselves in.
So far, so sensible.
But it’s based on two assumptions.
- That there are particular schools and LAs who are currently doing things well, and others less well, and
- By bringing the latter group up to the level of the former, we will improve attendance overall.
If 1. is true, pupils with low absence rates would be clustered in some schools more than others. And schools with low absence rates would be clustered in some LAs more than others.
Fortunately, this is something we can measure.
Pupil and school-level absence
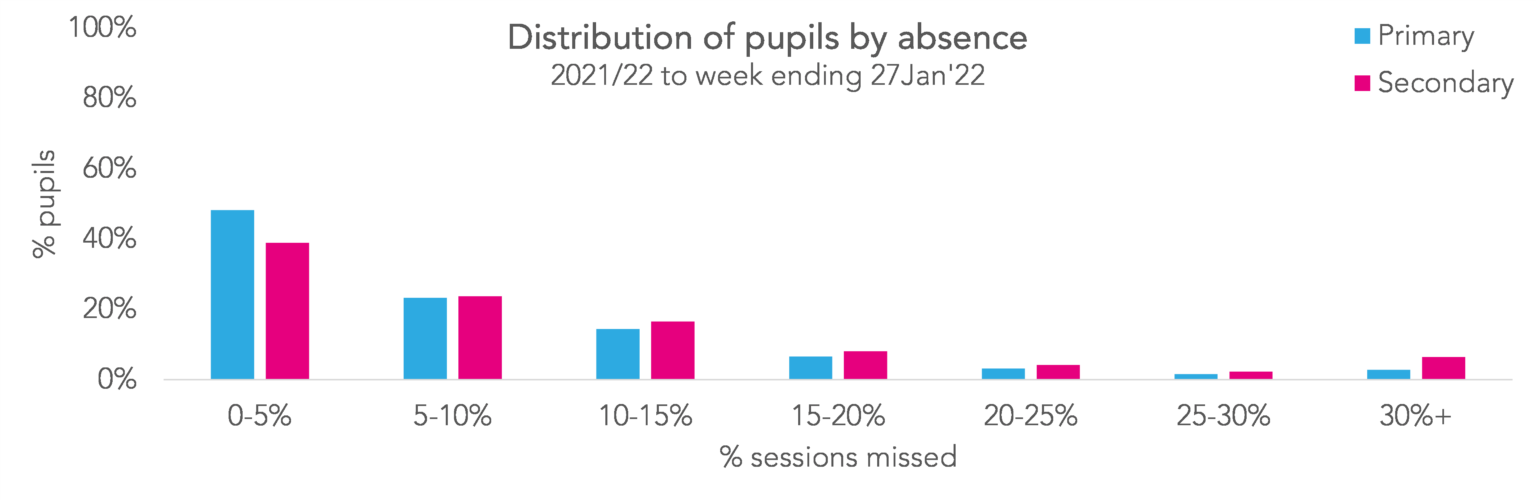
Let’s start by getting a feel for the data. Below, we plot the distribution of absence for pupils, then for schools. The data is from September 2021 to the end of last week, and covers the 5,200 primary and 2,600 secondary schools subscribed to Attendance Tracker.
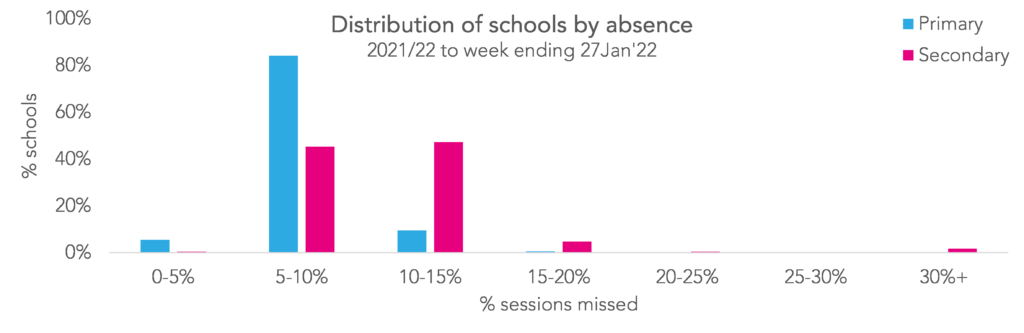
The majority of primary schools had absence rates of between five and ten percent. Secondary schools were a bit more spread out, but the majority still sat within a ten percent range – between five and fifteen percent.
In contrast, the distribution of pupils is wider. More pupils were in the 0-5% category than any other, but lots missed 15% or more.
Measuring variance between pupils, schools and Local Authorities
Moving on to the question of clustering.
We’ll measure how much of the variance between pupils’ absence rates is down to the school they attend, and how much is down to the LA their school is in. The more clustering there is, the more variance there’ll be between schools and between LAs[1]
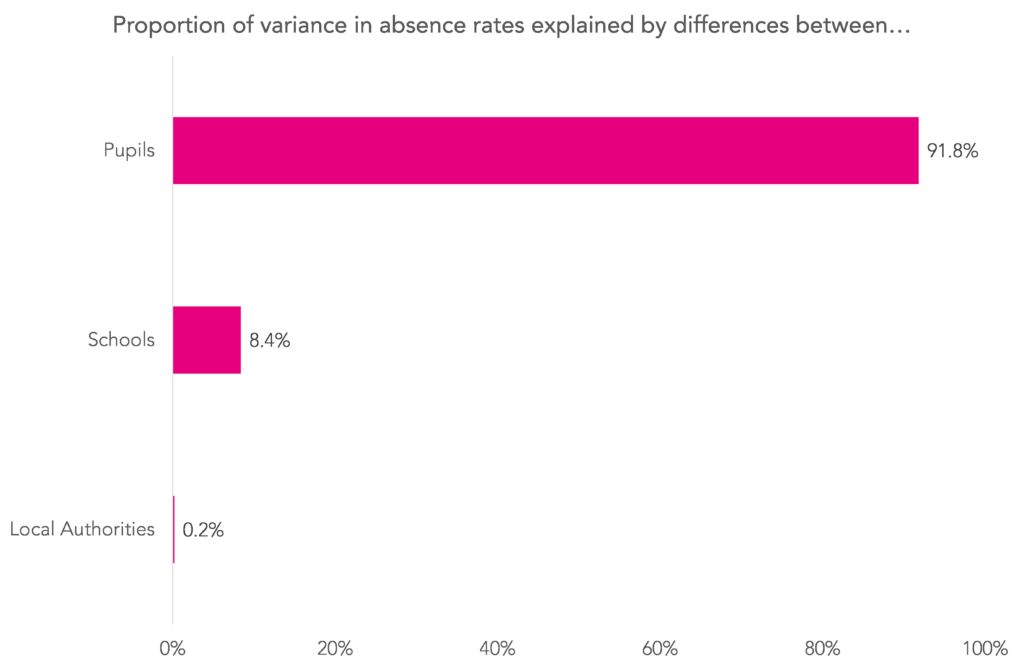
In total, 8.4% of the variance in absence rates is between schools, and just 0.2% is between LAs. The rest is between pupils (i.e. within schools).
When we add pupil disadvantage and SEN status into our model[2] – characteristics that we know are associated with absence – we get the following results:
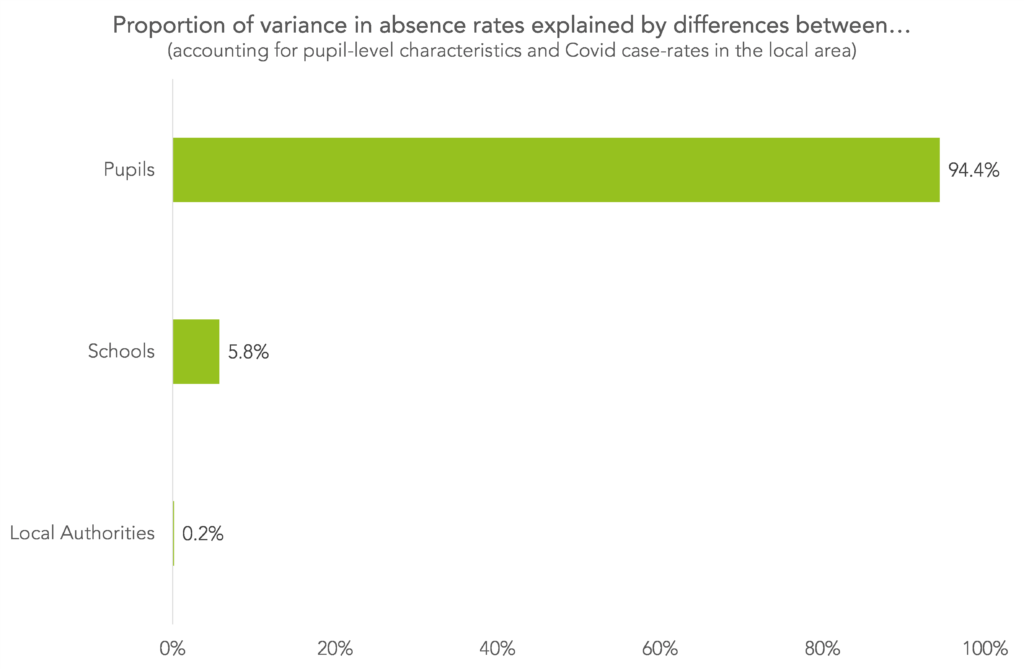
The amount of variance explained by the school has reduced to 5.8% from 8.4%. This is because disadvantaged pupils and pupils with SEN are not spread out evenly between schools.[3]
In both cases, although there is a small amount of detectable clustering at school-level, the vast majority of the variance can be explained by differences between pupils at the same schools.
A thought experiment
Now let’s test assumption 2.
If every school with above average absence could suddenly reduce it to the national average, the overall absence rate would change from 10.3% to 9.3% in secondary schools, and from 7.5% to 6.9% in primaries. A reduction of around 1 percentage point for secondaries and 0.6 of percentage point for primaries.
But what if we targeted individual pupils across all schools instead?
It turns out that the same impact could be had by improving the attendance of the bottom 20% of pupils in every secondary school by 5 percentage points. (The equivalent of one extra day in school every fortnight.) For primary schools, the bottom 15% would need to improve their attendance by 5 percentage points.
Of course, the costs of improving all schools to the national average and the costs of improving the attendance of the bottom 20% of all pupils may well be very different.
Aspire Attendance Tracker
Schools can track, analyse and compare their attendance data against 1,000s of other FFT schools using Aspire Attendance Tracker.
Log in to Aspire to access Attendance Tracker – log in here.
Not an FFT Aspire user? Learn more here.
Summing up
There’s nothing inherently wrong with the DfE’s proposals. But, on their own, they seem unlikely to have a big impact on absence rates.
Instead of strategies aimed at schools and Local Authorities, we need to target pupils with high rates of absence in all schools.
Given that pupils who miss the most school tend to have the most complex reasons for doing so, it’s hard to see how this could be done without new money on the table.
Want to stay up-to-date with the latest research from FFT Education Datalab? Sign up to Datalab’s mailing list to get notifications about new blogposts, or to receive the team’s half-termly newsletter.
Notes
1) We used a multilevel model with pupils nested in schools nested in LAs to partition the variance in absence rate within/between schools and LAs.
2) We also include average COVID case rates in the school’s neighbourhood to try to account for COVID-related disruption.
3) We could argue that identification of SEN is to some extent a school effect, i.e. schools have a role in deciding who their SEN pupils are, so the 5.8% of variance explained by the school might be an underestimate here.