This is the first part of a two-part article. The second part can be found here.
In this blogpost, we trace the school and social care histories of a single cohort of young people using the National Pupil Database (NPD).
We analyse the cohort born between 1 September 2002 and 31 August 2003 from when they first enter the state-funded education system, usually in nursery or Reception, through to when they reach school leaving age, usually when they are in Year 11. By state-funded education we mean mainstream schools, special schools, alternative provision schools[1] and local authority alternative provision. This latter group includes pupils who attend other forms of provision where the local authority pays fees, including independent schools, FE colleges and one-to-one tuition.
This part sets the scene. In part two we show the overlap between groups of pupils a) with special educational needs (SEN), b) who have been referred to social services and c) who attend alternative provision.
Size of the cohort
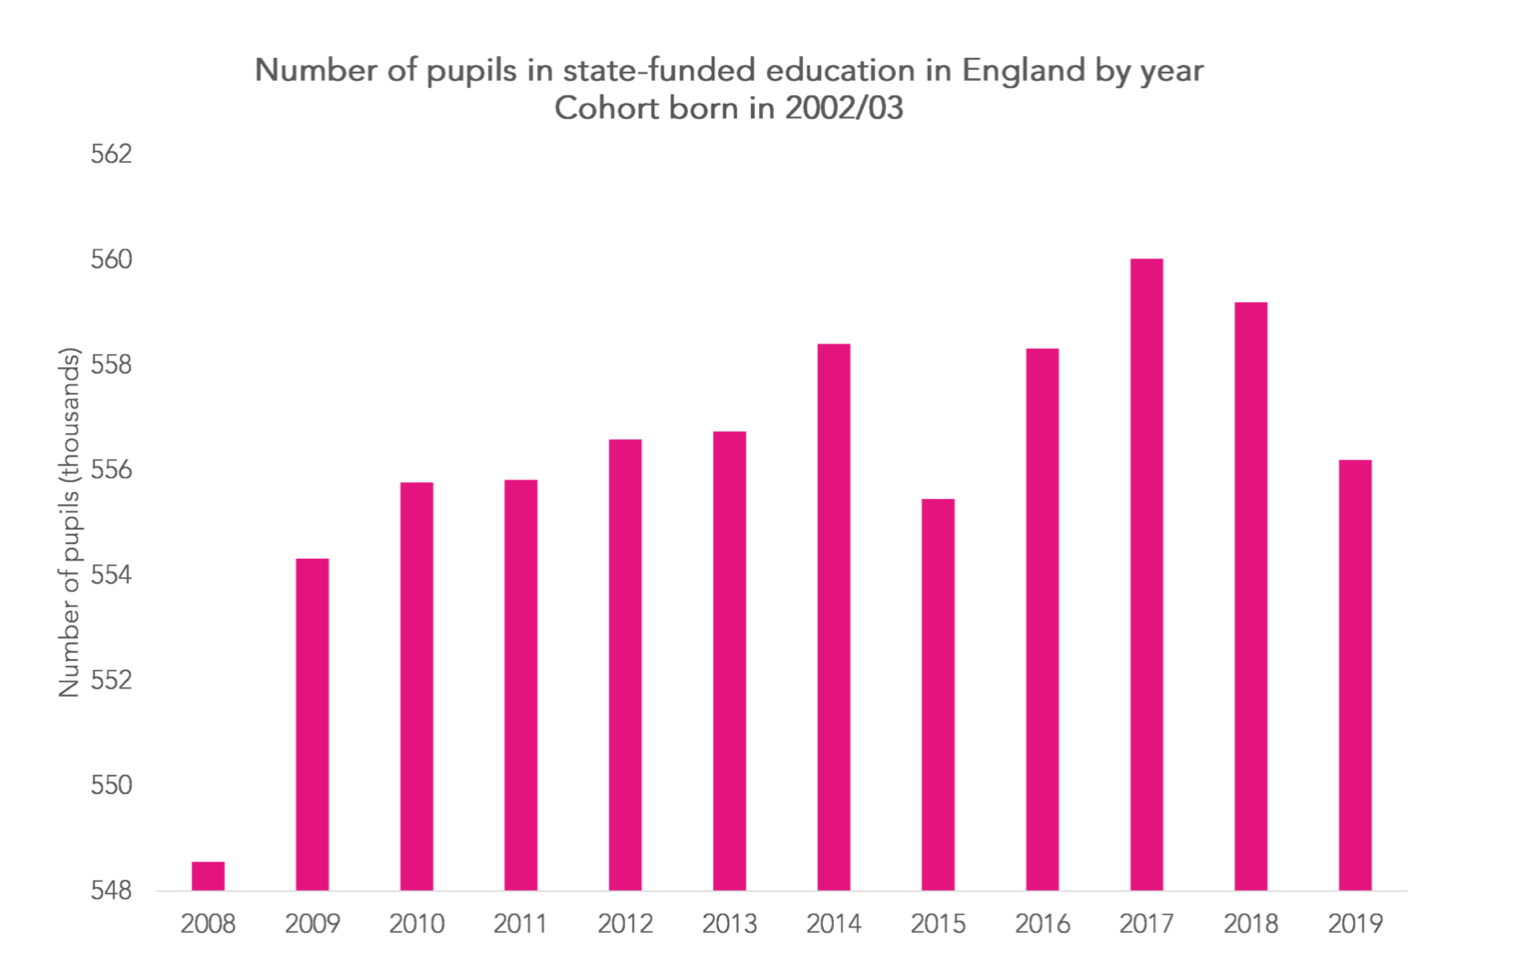
First of all, we show the total numbers of pupils on roll in state-funded education in January each year.

The chart shows numbers relative to the size of the cohort in January 2008 when pupils were in Reception. We see some growth in numbers by the following year as a result of additional pupils starting Reception in April 2008 or Year 1 in September 2008. After that, the cohort increases in size until 2014 after which there is a sudden dip. This is the year in which most pupils would have transferred to secondary schools. Some pupils are lost to the independent sector at this point. The cohort then increases in size again, reaching a maximum size of 560,000 in 2017 (Year 9). It then falls again in the final two years of the series.
But what the chart does not show is the number of pupils joining and leaving the cohort. In the chart below, we show for each year the number who join the cohort for the first time and the number who leave for the final time.

Most of the joiners shown for years 2010 onwards arise due to migration. This will also explain some of the leavers although there will be some exits from the system into home schooling. It is also worth noting that the chart does not show the extent of pupils spending some time outside of the system (e.g. if someone joined in reception and left in Year 11 but spent some time overseas in between).
In total, we observe 635,000 pupils who are part of the cohort at some point up to age 16.
The number who experience alternative provision
We have written previously about how many pupils attend AP schools, when and why.
The following chart shows the number of pupils who attended an AP school during each year and the number who had ever accessed an AP school by each year.

In total, some 21,000 pupils in the cohort accessed a state-funded AP school during their school career, the vast majority between 2017 and 2019 (i.e. at academic ages 13 to 15).
Expanding the chart to include those in local authority alternative provision, which includes pupils placed in independent special schools as well as alternative provision, increases the number to have received state-funded education outside of mainstream or special schools to 25,000.

3.3% of pupils in the cohort attended a state-funded AP school at some point during their career up to school leaving age. Including those who experience local authority alternative provision increases the percentage to 4.0%.
The number with referrals to social services
The Children in Need (CIN) census submitted by local authorities each year contains records of young people for whom a referral for a needs assessment by social services is accepted by the local authority. They remain part of the census for as long as they have an open case with the local authority. Many, but not all, will be legally defined as in need under the Children Act 1989. Some will have their case closed with no further action after a needs assessment (see Emmot et al, 2018) and some will have spent time in care.
Local authorities submit unique pupil numbers (UPNs) but not names as part of their return to DfE. This enables the census to be matched to NPD for those pupils with UPNs, in other words, those attending state-funded schools. This means that children below school age, those attending independent schools and those attending schools in Wales or Scotland are not matched to NPD.
The CIN census was first carried out in 2008/09. This means we can observe social care histories for our cohort from that point onwards. Anyone referred to social services before 2008/09 but never since would not be observed as ever being in need. Some details of previous referrals prior to 2008/09 for those who subsequently come into care are observed.

By the end of 2019, 130,000 young people in the cohort (21%) had been referred to social services. This is close to the estimate by Jay et al that 25% of young people are referred by their 16th birthday.
The number of pupils classified as having SEN
In the chart below, we show the number of pupils classified as having special educational needs (SEN) in January each year and the cumulative number ever known to have been classified as SEN by the end of each year.

Numbers being classified as SEN for the first time rise sharply during the early primary years then tail off. Numbers classified as SEN each January also rise then fall. The SEN code of practice changes of 2014 would have played a part although it tends to be the case that rates of SEN in secondary schools tends to be lower than in primary.
By the end of 2019, almost 250,000 pupils (39%) had been classified as SEN.
We also show how many SEN pupils were identified as ever having behavioural, emotional or social difficulties (BESD) or social, emotional and mental health needs (SEMH) [2] as either their primary or secondary SEN type [3].

Numbers classified as BESD or SEMH increased steadily each year, even in secondary schools, with a marked jump between 2014 and 2015 following secondary transfer for the majority. However, this coincided exactly with the introduction of the SEMH code into School Census. Some of this uplift may be due to pupils classified as SEMH but who were not previously classified as BESD.
In total, almost 56,000 SEN pupils are classified as BESD or SEMH.
So among this cohort of 635,000 young people, we find that 21% had ever had a children in need referral, 39% had ever been identified as having special educational needs and 4% experience alternative provision.
In the next part, we will look at the overlap between these groups.
Want to stay up-to-date with the latest research from FFT Education Datalab? Sign up to Datalab’s mailing list to get notifications about new blogposts, or to receive the team’s half-termly newsletter.
Footnotes
- 1) Pupil referral units, alternative provision academies, alternative provision free schools.
- 2) Prior to 2014, pupils’ primary and secondary needs were recorded in the School Census if they had SEN met by a Statement or School Action Plus. Following the code of practice changes, primary and secondary needs have been collected for pupils with SEN met by School Support or an Education, Health and Care Plan (EHCP).
- 3) Here primary and secondary mean major and minor rather than referring to types of school.